Gallery
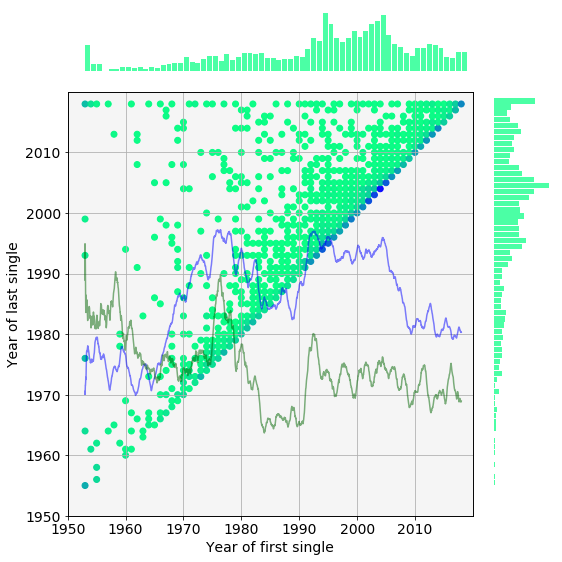
Histogram of first and last appearances of record labels based on the UK singles chart. If you are curious when the record market was the most balanced read this analysis.
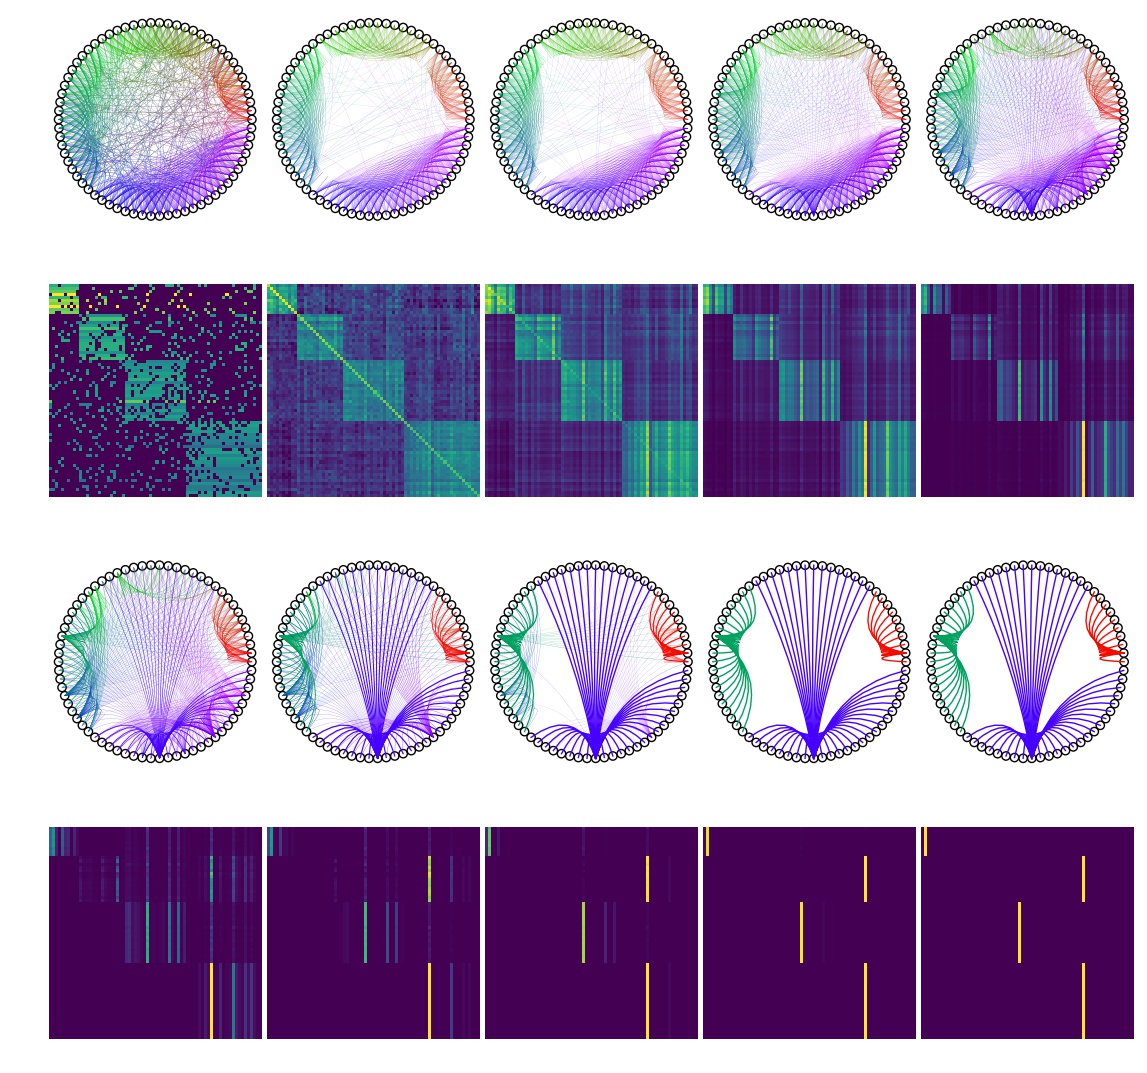
Subsequent steps of Markov cluster algorithm. The circles on the perimeter represent nodes, whilst the coloured lines are drawn with a thicknes proportional to the weight of the edges between the nodes. The blue squares represent the connectivity matrices. As the algorithm progresses, weaker connections are gradually removed and merged in to stronger ones. For a full explanation and implementation of the algorithm see this blog post.
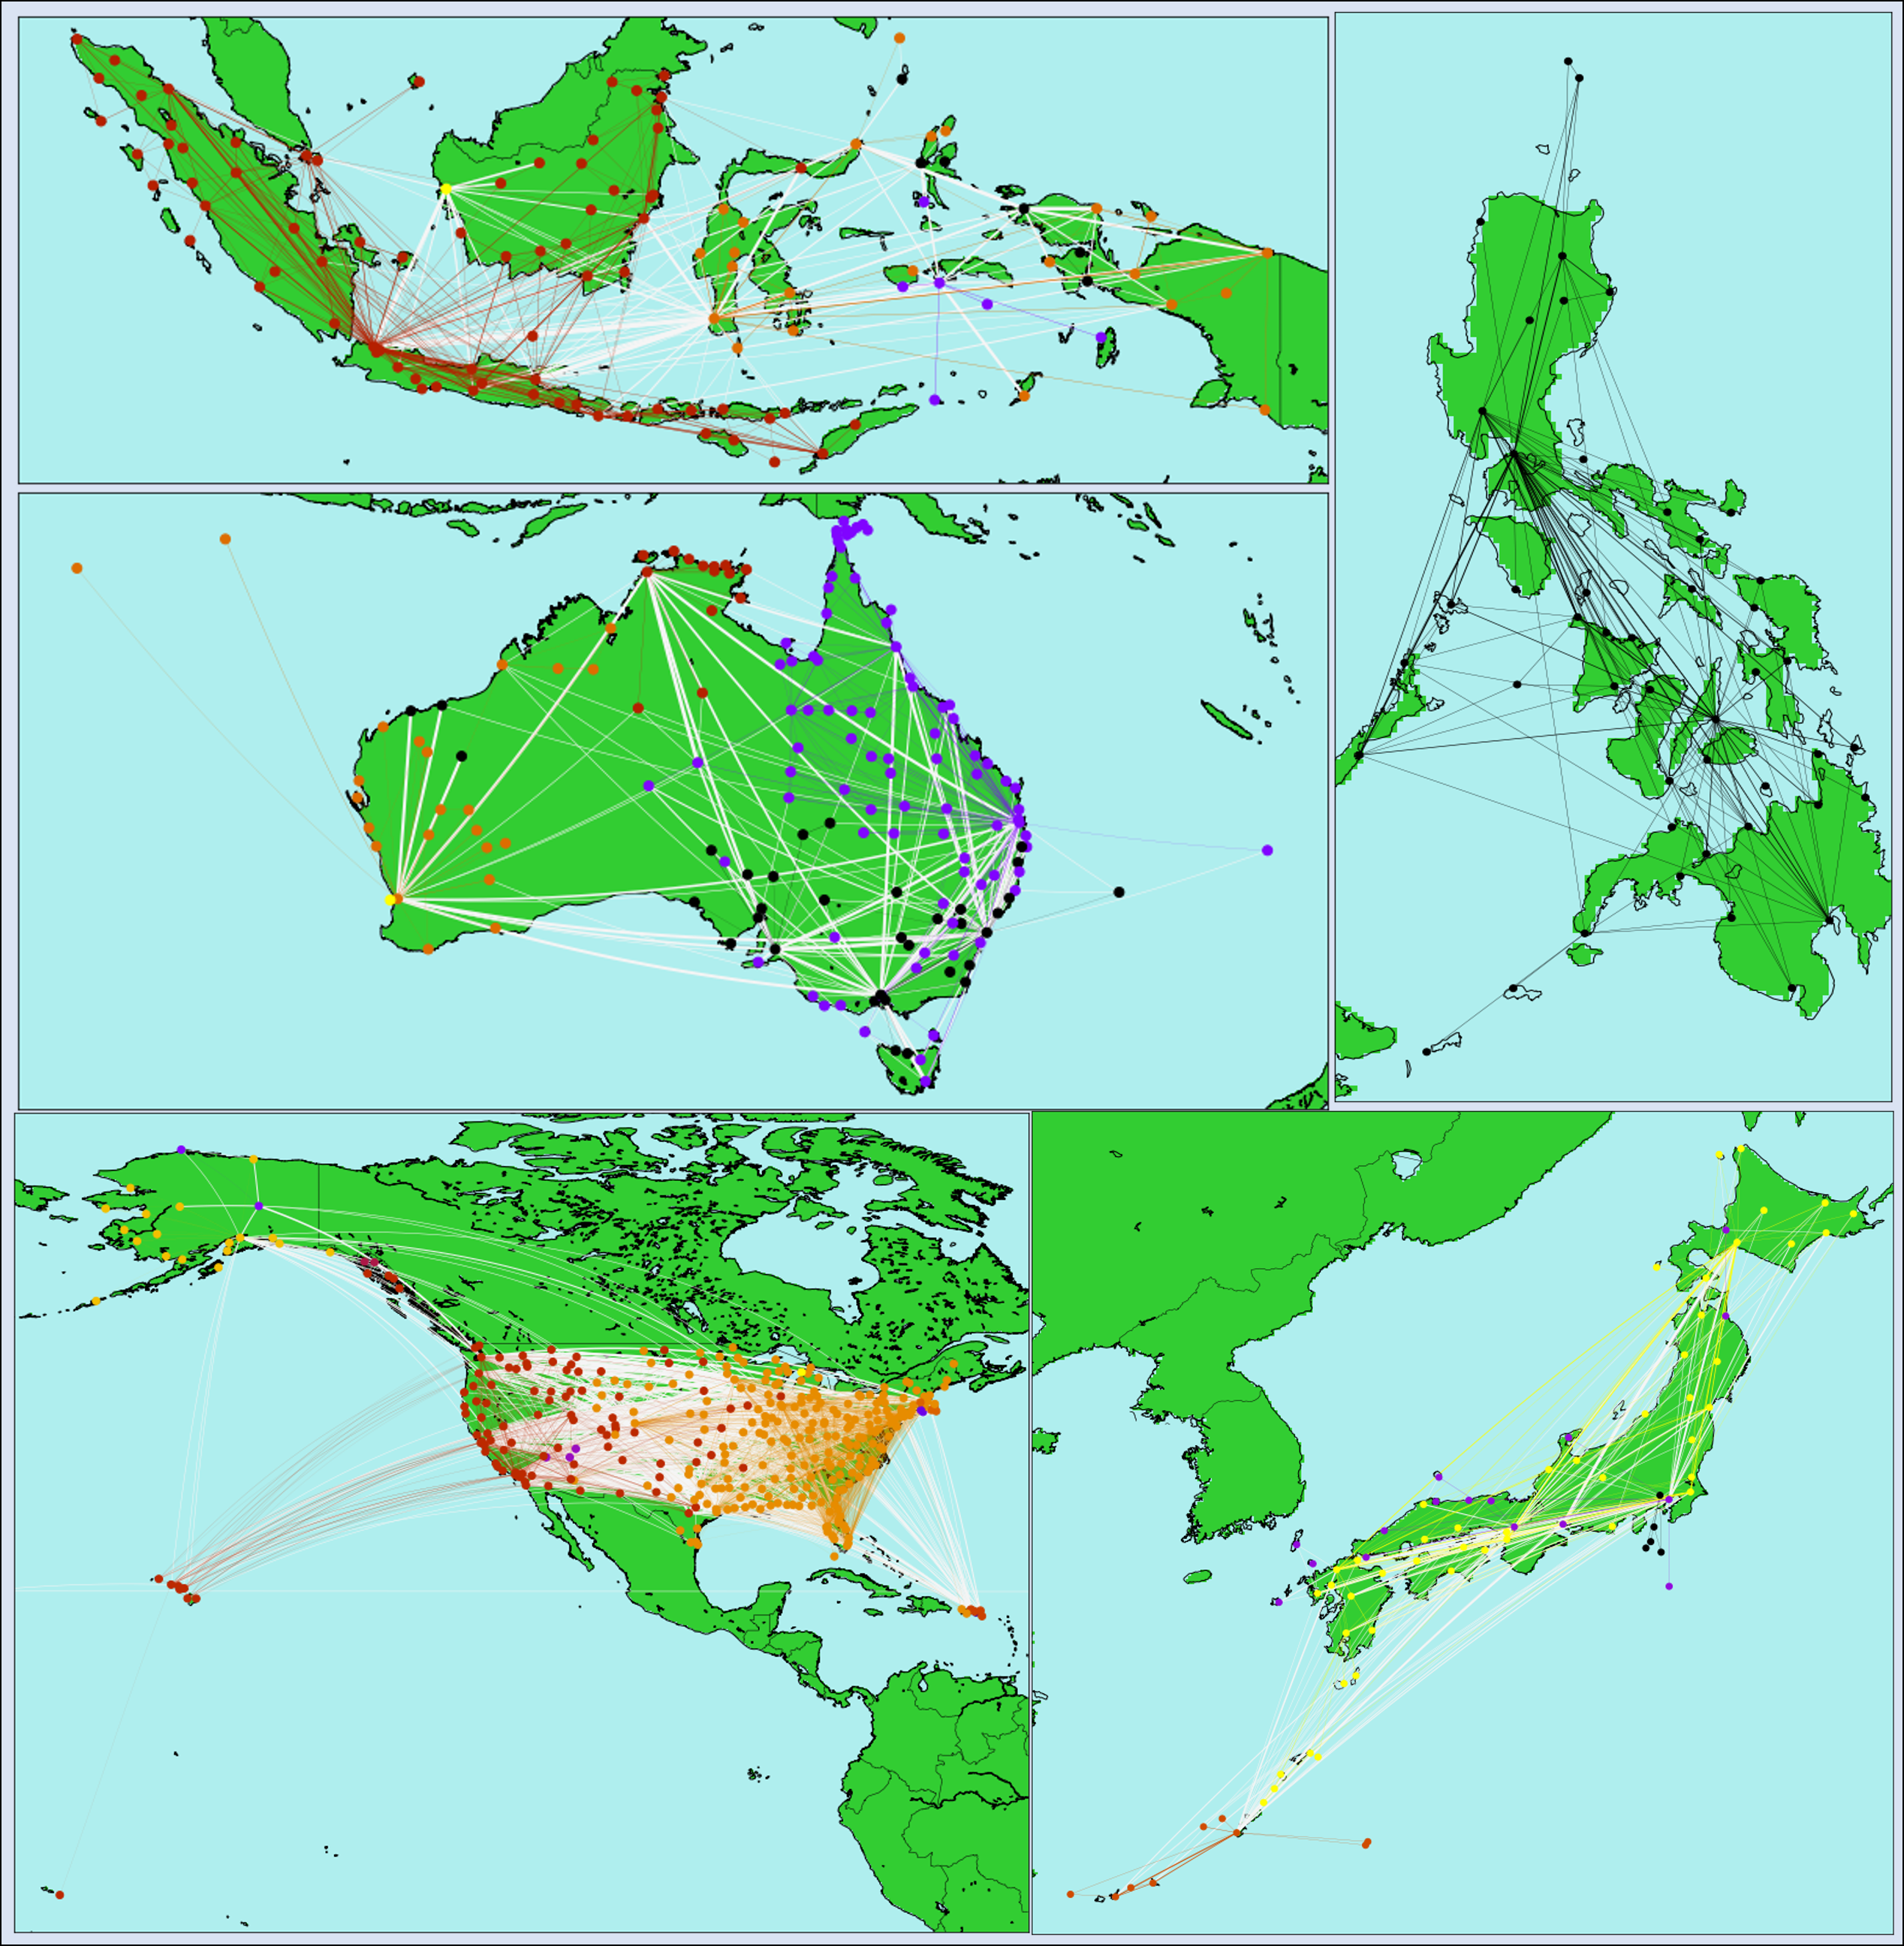
Markov clustering in action: clusters of airports. The strength of connection is determined by the number of arilines carrying passengers between the various domestic destinations. The full journey creating of this figure can be followed here.
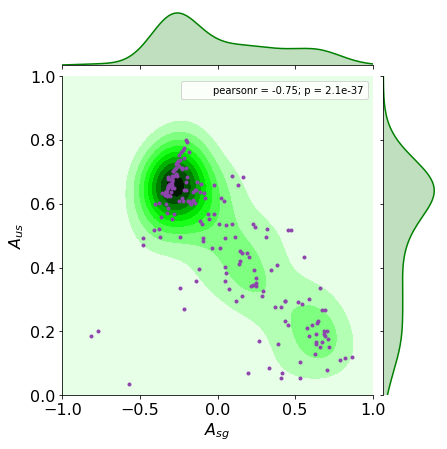
If a country has asymmetric visa requirements with respect to all the other countries, the visitors to that country are likely to face stricter entry requirements compared to those required from the citizens of the host country when travelling abroad. Find all the maths here.
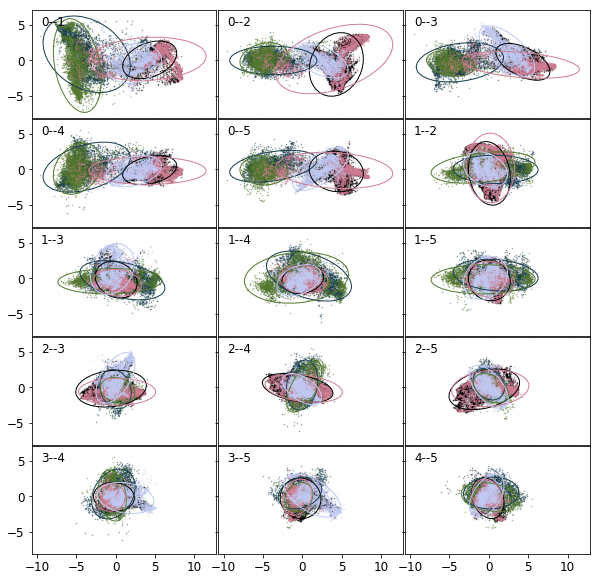
Linear discriminant analysis of the climate data. To figure out why LDA is a suboptimal to cluster temperature and precipitation records follow this data pipeline.

On the top of Kuh-e Sabalan (4800m (16750 feet), corrected for height of the caldera). I used a gradient following algorithm to summit the peak. On the way down, I heavily relied on stochastic gradient search - definitely not on steepest descent.